Maps, Tables, and Figures
Lab Eleven and Twelve Figures:
Lab Ten Figures:

Figure 1: ArcGIS Collector
Image Source: https://www.esri.com/en-us/arcgis/products/arcgis-collector/overview

Figure 2: Try Collector tutorial

Figure 3: Tutorial part 2

Figure 4: Maps tab on phone

Figure 5: Tutorial part 3

Gif 1: Streaming a path
Lab Nine Figures:

Figure 1: ESRI Coordinate Systems Tutorial

Figure 2: Conformal Projection

Figure 3: Equal Area Projection

Figure 4: Equidistant Projection

Figure 5: Azimuthal Projection

Figure 6: Gnomonic Projection

Figure 7: Compromise Projection

Figure 8: ESRI Certificate
Lab Eight Figures:
 Figure 1: Example of GCP on a base map

 Figure 2: GCP given
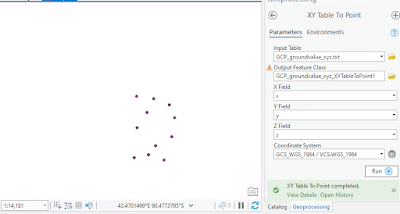 Figure 3: Antarctica
 Figure 4: Datasheet used


Lab Seven Figures:

Figure 1: MGC Homescreen
 Figure 2: MGC control checklist function from tutorial

 Figure 3: MGC Airmap over Washington, D.C. USA

 Figure 4: Grid flight example from tutorial

 Figure 5: Settings menu

Lab Six Figures:
 Figure 1: M600 in flight

 Figure 2: Flight checklist

 Figure 3: Flight Controller

 Figure 4: The DJI Matrice M600 Pro
 Figure 5: Takeoff 1
 Figure 6: Takeoff 2
 Figure 7: Takeoff 3


 Figure 8: The Satchel for carrying the pads
 Figure 9: Point 1
 Figure 10: Point 2
 Figure 11: Field being observed
 Figure 12: Point placed in grass
 Figure 13: Point placed below tree (Bad Spot)
 Figure 14: Point placed below tree (Bad Spot)


Lab Five Figures:

Figure 1: ArcGIS Pro Opening Screen

Figure 2: ArcGIS logo

Figure 3: Microsense RedEdge Peak Band Reflectance

Figure 4: Doakburn field pre-burn

Figure 6: symbology window

Figure 5: Doakburn field post-burn

Figure 7: Pre burn image with bands 5,3,2

Figure 8: Post burn image with bands 5,3,2

Figure 9: Post burn image with bands 4,3,2

Figure 10: Post burn image with bands 1,4,5

Figure 11: Postburn NDVI B/W

Figure 12: Preburn NDVI B/W

Figure 13: NDVI color non-gradient

Figure 14: NDVI color gradient
Lab Four Figures:

Figure 1: Landsat Explorer Home screen

Figure 2: Color Infrared of Greater Lafayette Area

Figure 3: Moisture Index Filter of Greater Lafayette Area

Figure 4: Vegetation Index of the Greater Lafayette Area

Figure 5: Moisture Index of a Mojave Desert Town

Figure 6: Vegetation Index of a Mojave Desert Town

Table 1: Outdated Index Table

Figure 7: Geography Filter of Greater Lafayette Area

Figure 8: Short wave IR of Greater Lafayette Area
Lab Three Figures:

Figure 1: ArcGIS Earth Homepage

Figure 2: Options Tab

figure 3: Elevation Profile

figure 4: Line of Sight

figure 5: View-Shed

Figure 6: Add Data Tab

Figure 7: ArcGIS Online My Content Tab

Figure 8: ArcGIS Online, ArcGIS Online Tab

Figure 9: Farmland in DeMotte Indiana with NDVI

Figure 10: US wildfire set shown over California

Figure 11: Lafayette Area with NAIP Imagery: Color Infrared.

Figure 12: Hotspot Information
Lab Two Figures:

figure 1: drone swarm
Lab One Figures:
 |
| figure 1: My Partner and I |


Comments
Post a Comment